
Fewer than one in three websites passes Google’s Core Web Vitals assessment today. This checklist covers every confirmed threshold, the December 2025 Rendering Update most SEOs missed, and the INP fixes that separate sites ranking on page one from sites stuck on page two.
Fewer than one in three websites currently passes Google’s Core Web Vitals assessment. That number has stayed stubbornly low for years, even as Google has repeatedly confirmed these metrics as confirmed ranking signals. The gap is not a knowledge problem. Most SEO teams know what LCP, INP, and CLS stand for. The gap is an execution problem, compounded by three significant changes since mid-2024 that most published checklists have not addressed.
This checklist gives you the current thresholds, the prioritized fixes, and the 2026-specific updates that make this iteration different from anything published before the December 2025 Rendering Update. Work through it in order. The sections are sequenced by impact.
What Changed: Three Updates You Need to Know
Three developments define the current Core Web Vitals landscape. Each one requires a separate response from your technical team.
First, Interaction to Next Paint replaced First Input Delay as the official interactivity metric in March 2024. FID measured only the delay before a user’s very first interaction on a page. INP tracks every click, tap, and keyboard input throughout an entire session and reports the single worst-performing interaction. Sites that passed FID comfortably are now failing INP because the two metrics measure fundamentally different things. Only 64% of sites currently meet the INP good threshold, compared to 93% that met FID.
Second, Google’s December 2025 Rendering Update clarified that pages returning non-200 HTTP status codes, including 404 and 5xx errors, may now be excluded from the rendering pipeline entirely. If your site serves dynamic content via client-side JavaScript on error pages, Googlebot may never process that content at all. This is a significant crawl efficiency issue that most sites have not audited for.
Third, the relationship between Core Web Vitals and AI search has been quantified. An analysis of over 107,000 pages appearing in Google AI Overviews found no strong positive correlation between passing CWV and AI citation frequency. However, severe performance failures did correlate negatively. The conclusion matters strategically: Core Web Vitals are a gate you must pass through, not a lever that elevates you above competitors after you have passed.
The Threshold Table: Your Pass/Fail Reference
Google evaluates Core Web Vitals at the 75th percentile of real user sessions using Chrome UX Report field data. The scores below are what matter for ranking. Your Lighthouse lab score is useful for diagnosis but is not what Google uses.
| Metric | Measures | Good | Needs Work | Poor |
|---|---|---|---|---|
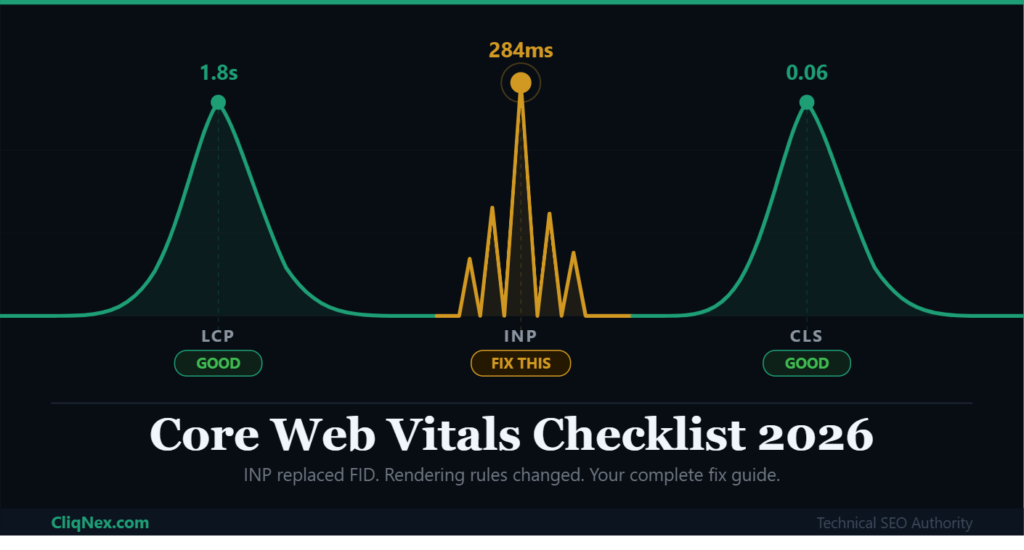
| LCP Largest Contentful Paint | Loading speed | Under 2.5s | 2.5 to 4s | Over 4s |
| INP Interaction to Next Paint | Interactivity | Under 200ms | 200 to 500ms | Over 500ms |
| CLS Cumulative Layout Shift | Visual stability | Under 0.1 | 0.1 to 0.25 | Over 0.25 |
One forward-looking note: Google has signaled it is evaluating Smooth Interactions as a potential future metric, and performance researchers expect the INP good threshold could tighten to 150ms as device capabilities improve. Optimize to 150ms now if your architecture supports it. You will be ahead of a threshold shift most competitors have not read about yet.
LCP Checklist: Fix Your Largest Contentful Paint
LCP measures how quickly the largest visible element in the viewport loads. That element is typically a hero image, a video thumbnail, or a large text block. Google data shows that image download time accounts for only about 10% of total LCP time. The bigger culprits are server response time and render-blocking resources.
Target a Time to First Byte below 200ms before addressing anything else. Every other LCP fix operates downstream of your server response. Edge computing services like Cloudflare Workers or Vercel Edge Functions can reduce TTFB by 40 to 70% by executing logic closer to the user.
- Reduce TTFB to under 200ms. Use a CDN with edge caching. For WordPress sites, WP Rocket combined with Cloudflare handles both server-level and CDN caching. For Next.js, Incremental Static Regeneration gives you static speed with dynamic freshness.
- Preload your LCP element. Add a preload hint for your hero image in the document head using <link rel=”preload”>. This single change can reduce LCP by 300 to 500ms on image-heavy pages.
- Convert images to WebP or AVIF. AVIF delivers 50% better compression than JPEG at comparable quality. Most modern CDNs handle format conversion automatically.
- Defer non-critical JavaScript. Render-blocking scripts delay the browser from painting your LCP element. Use the defer or async attribute on all scripts that are not required for the initial render.
- Implement lazy loading selectively. Apply lazy loading to images below the fold only. Never lazy load the LCP element itself. That is the most common LCP mistake on image-heavy sites.
- Audit third-party scripts. Analytics pixels, chat widgets, and ad scripts compete for main-thread time. Audit every third-party tag and load non-essential ones after the page becomes interactive.
“Image optimization alone rarely fixes LCP. In the majority of audits we conduct, server response time is the primary bottleneck. Sites running on shared hosting with no CDN are essentially asking Google to wait before it can even start rendering their most important content.”
Barry Adams, Technical SEO Consultant and Founder, Polemic Digital
INP Checklist: The Metric Most Sites Are Still Failing
INP is now the hardest Core Web Vital to pass, particularly on mobile. Mobile devices have fewer CPU resources available, which means JavaScript tasks that run smoothly on a desktop can produce INP scores well above 500ms on a mid-range Android phone. Every INP interaction has three phases: input delay, processing time, and presentation delay. Fixes must target the phase causing the bottleneck.
The most common cause of poor INP is long tasks blocking the main thread. Any JavaScript task running for more than 50ms is classified as a long task. While that task runs, the browser cannot respond to user input, which pushes INP scores higher.
- Break long JavaScript tasks into chunks under 50ms. Use requestIdleCallback or scheduler.yield to break heavy processing into smaller units. This yields control back to the browser between tasks and keeps interactions responsive.
- Move heavy computation off the main thread. Web Workers allow JavaScript to run in a separate thread entirely. Offload tasks like data processing, sorting large arrays, or complex calculations that do not require DOM access.
- Reduce DOM size. Pages with more than 1,500 HTML elements experience significantly worse INP because every interaction triggers reflows and repaints across a larger structure. Audit DOM size in Chrome DevTools under Performance Insights.
- Lazy load third-party widgets. Chat tools, social embeds, and ad scripts are among the largest contributors to poor INP on publisher and e-commerce sites. Use facade patterns to load these only when a user actually requests them.
- Consider Island Architecture for JavaScript-heavy pages. Frameworks like Astro and recent versions of Next.js support partial hydration, where only interactive components are hydrated rather than the entire page. This technique directly reduces main-thread execution time and is one of the most effective INP improvements available in 2026 for SPA and e-commerce sites.
Industry Benchmark
Average mobile INP scores by vertical: E-commerce sites average 312ms, SaaS platforms average 345ms, and news publishers average 289ms. If your score sits above these figures, you are below the median for your industry and losing ground to better-optimized competitors.
CLS Checklist: Stop Your Layout From Shifting
Cumulative Layout Shift measures how much visible content moves unexpectedly while a page loads. A score above 0.1 tells Google that users on your site are experiencing frustrating visual instability, which frequently causes accidental clicks and broken reading experiences. CLS is also the most fixable of the three metrics, with several causes that have direct and immediate solutions.
- Set explicit width and height on all images and video elements. This single fix resolves the majority of CLS issues on content sites. The browser reserves the correct space before the image loads, preventing the page from shifting when it arrives.
- Reserve space for advertisements and embeds. Ad slots that inject dynamically into the page without a reserved container are a leading CLS cause on monetized content sites. Use CSS min-height on ad containers to lock space before the ad renders.
- Use font-display: swap with preloaded fonts. Web fonts that load late can cause text to reflow as the font replaces the fallback. Combine font-display: swap with a preload tag for your primary font to minimize the fallback window.
- Avoid inserting content above existing content after load. Cookie banners, promotional notifications, and chat popups that push page content down are major CLS contributors. Load them as overlays or within pre-reserved space rather than injecting them into the document flow.
How to Measure Accurately: Field Data vs Lab Data
This distinction matters more than most optimization guides acknowledge. Google uses Chrome User Experience Report field data, measured at the 75th percentile of real user sessions over a rolling 28-day window, when evaluating Core Web Vitals for ranking purposes. Your Lighthouse score, PageSpeed Insights lab data, and local DevTools results do not directly determine your ranking position. They are diagnostic tools.
The practical implication is that you can improve your Lighthouse score significantly while your field data in Google Search Console remains poor. This happens when optimizations work in controlled lab conditions but fail on actual user devices, slower connections, or older browsers. Always validate your improvements in the Core Web Vitals report inside Google Search Console before reporting success.
For ongoing monitoring, use Google Search Console CWV Report for field data trends, PageSpeed Insights for per-URL diagnosis, Chrome DevTools Performance Panel for long task analysis, and DebugBear or web-vitals.js for real user monitoring that identifies which specific interactions are causing INP failures.
Core Web Vitals and AI Search: What the Data Actually Shows
A study analyzing 107,352 pages appearing in Google AI Overviews found no strong positive correlation between passing Core Web Vitals and AI citation frequency. Improving your LCP from 2.3 seconds to 1.8 seconds does not measurably increase your probability of appearing in an AI-generated answer. The AI systems selecting sources are primarily evaluating content clarity, intent alignment, and authority signals.
However, a measurable negative relationship exists at the extremes. Pages with severely poor performance, particularly those with LCP above 4 seconds or INP above 500ms, were associated with lower AI visibility. The most likely mechanism is indirect: poor performance increases bounce rates and lowers engagement metrics, which in turn reduces the behavioral signals that AI systems use to infer content quality.
The strategic position for CliqNex readers: treat Core Web Vitals as infrastructure, not a growth lever. Fix failures to protect your baseline. Then compete on content depth, citation-worthy specificity, and structured data to win AI Overviews placements.
Frequently Asked Questions
Do Core Web Vitals directly affect Google rankings?
Yes. Google confirmed Core Web Vitals as ranking signals in 2021 and has continued to weight them within its page experience evaluation. They function as a tiebreaker in competitive niches: when two pages have comparable content quality and authority, the page with better Core Web Vitals scores holds a measurable ranking advantage. Content relevance remains the stronger signal, but CWV failures can actively suppress pages that would otherwise rank well.
What replaced First Input Delay in Core Web Vitals?
Interaction to Next Paint (INP) replaced First Input Delay (FID) in March 2024. FID measured only the delay before a user’s first interaction during page load. INP measures the response latency of every user interaction throughout an entire session and reports the worst-performing one. INP is a stricter and more comprehensive standard, which is why many sites that passed FID are now failing INP.
How long does it take to see ranking improvements after fixing Core Web Vitals?
Google’s Core Web Vitals report in Search Console refreshes based on a 28-day rolling window of real user data. After implementing fixes, expect to see metric improvements reflected in Search Console within 4 to 6 weeks. Ranking changes may take longer, since Google’s algorithm considers many additional factors. Most sites see measurable ranking movement within 2 to 3 months of sustained good scores across all three metrics.
Does passing Core Web Vitals improve your chances of appearing in AI Overviews?
Not directly. Research on over 107,000 pages cited in AI Overviews found no strong positive correlation between passing Core Web Vitals and AI citation frequency. Passing CWV is table stakes that prevents your site from being penalized, but it does not give you an advantage in AI-generated answers. Content authority, topical depth, structured data implementation, and intent alignment are the factors that primarily determine AI citation probability.